


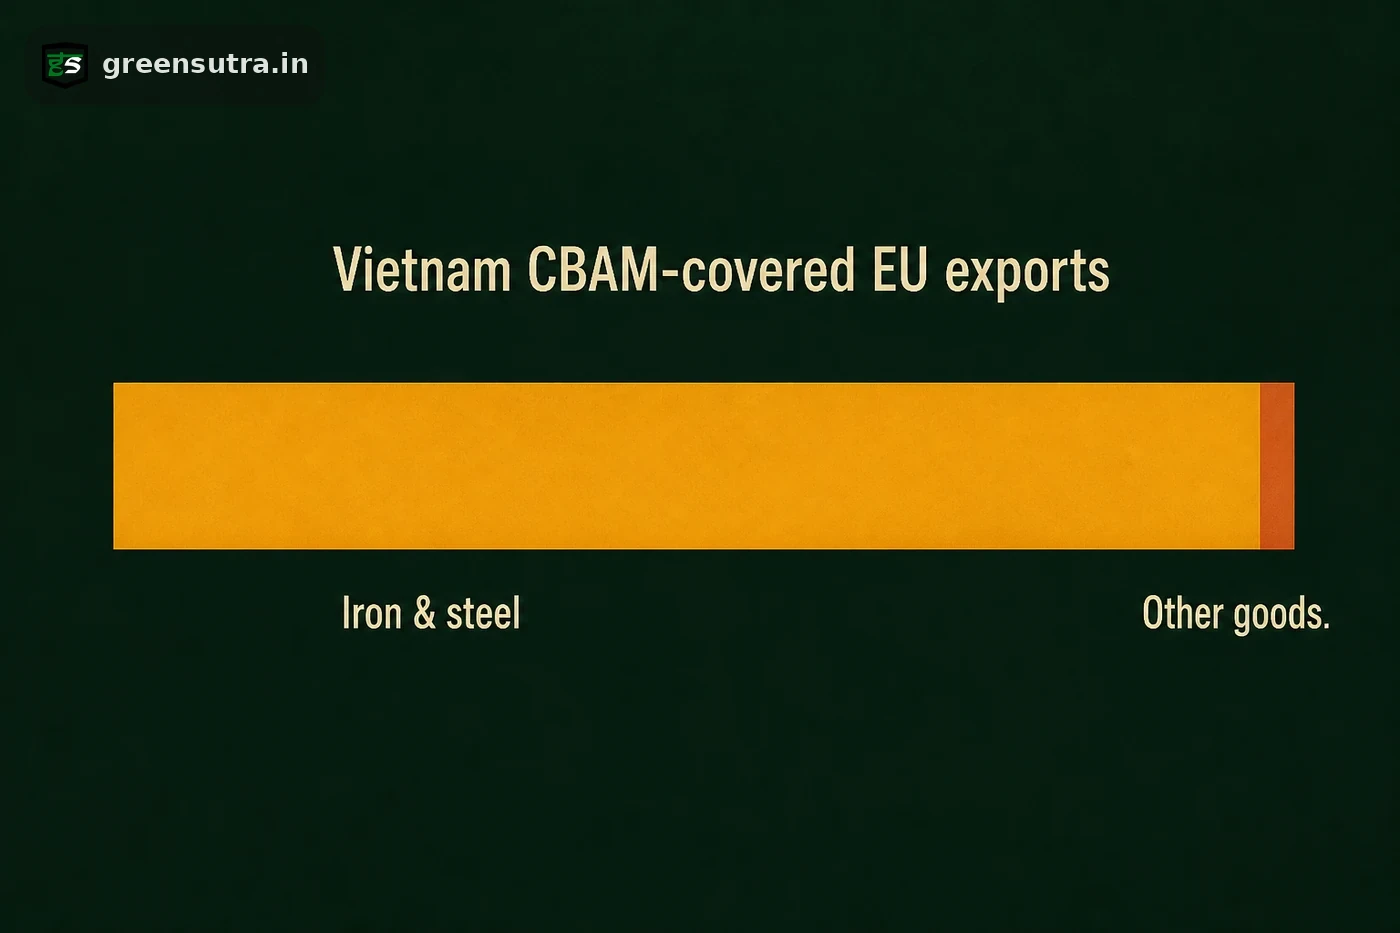
Iron and steel make up almost all of Vietnam’s CBAM-covered exports to the EU, so CBAM concentrates almost entirely on its steel mills. Vietnam ships over EUR 2.2 billion of iron and steel to the EU each year, a higher concentration than India or Ukraine, and because only steel’s direct emissions are priced, the production route drives most of the figure.
CBAM bears on Vietnamese steel because iron and steel account for almost all of the country’s CBAM-covered trade with the EU. When one covered group dominates a country’s exports, the mechanism concentrates there instead of spreading across many product lines. Iron and steel is an Annex II good, so only direct embedded emissions are priced, and the production route therefore sets most of the figure a mill reports.
Why one group carries the whole position
Such concentration is unusual, and it carries a practical upside. A single data-collection effort covers most of the country’s obligation, so a mill that maps the embedded emissions of its main product lines addresses the bulk of what CBAM asks for.
| Origin | Iron and steel share of CBAM-covered EU exports |
|---|---|
| Vietnam | about 96 percent |
| Ukraine | about 92 percent |
| India | about 90 percent |
What sets the priced figure
Two variables drive the number for a direct-only good like steel. The production route fixes the embedded emissions intensity, and the data source fixes whether that intensity is the plant’s own verified figure or the country-of-origin default carrying its mark-up. Where no country value is published, a fallback applies, for example 3.48 tonnes of CO2e per tonne of pig iron, a conservative figure that verified data can often beat. The payable share of those emissions starts at 2.5 percent for 2026 imports and reaches 100 percent by 2034, so the distance between a default and a lower verified figure widens every year.
Preparing early
Concentration in one group means a focused effort goes a long way:
- Identify the production route for each product line, since BF-BOF, gas-based DRI-EAF and scrap-based EAF give very different intensities.
- Gather verified actual installation data rather than accepting the marked-up country default.
- Confirm which consignments clear the 50 tonne per importer per year de-minimis and stay in scope.
- Assemble the records before the first annual declaration, when verified emissions take time to compile.
CBAM compliance support covers declarant status, embedded-emissions calculation by production route, and certificate obligations for steel consignments. GreenSutra’s consultants find that scrap-EAF mills often hold a genuine advantage over the default that only verified data will surface. The CBAM guide sets out the evidence a declaration requires.
Sources: Regulation (EU) 2023/956 · Eurostat · European Commission CBAM