


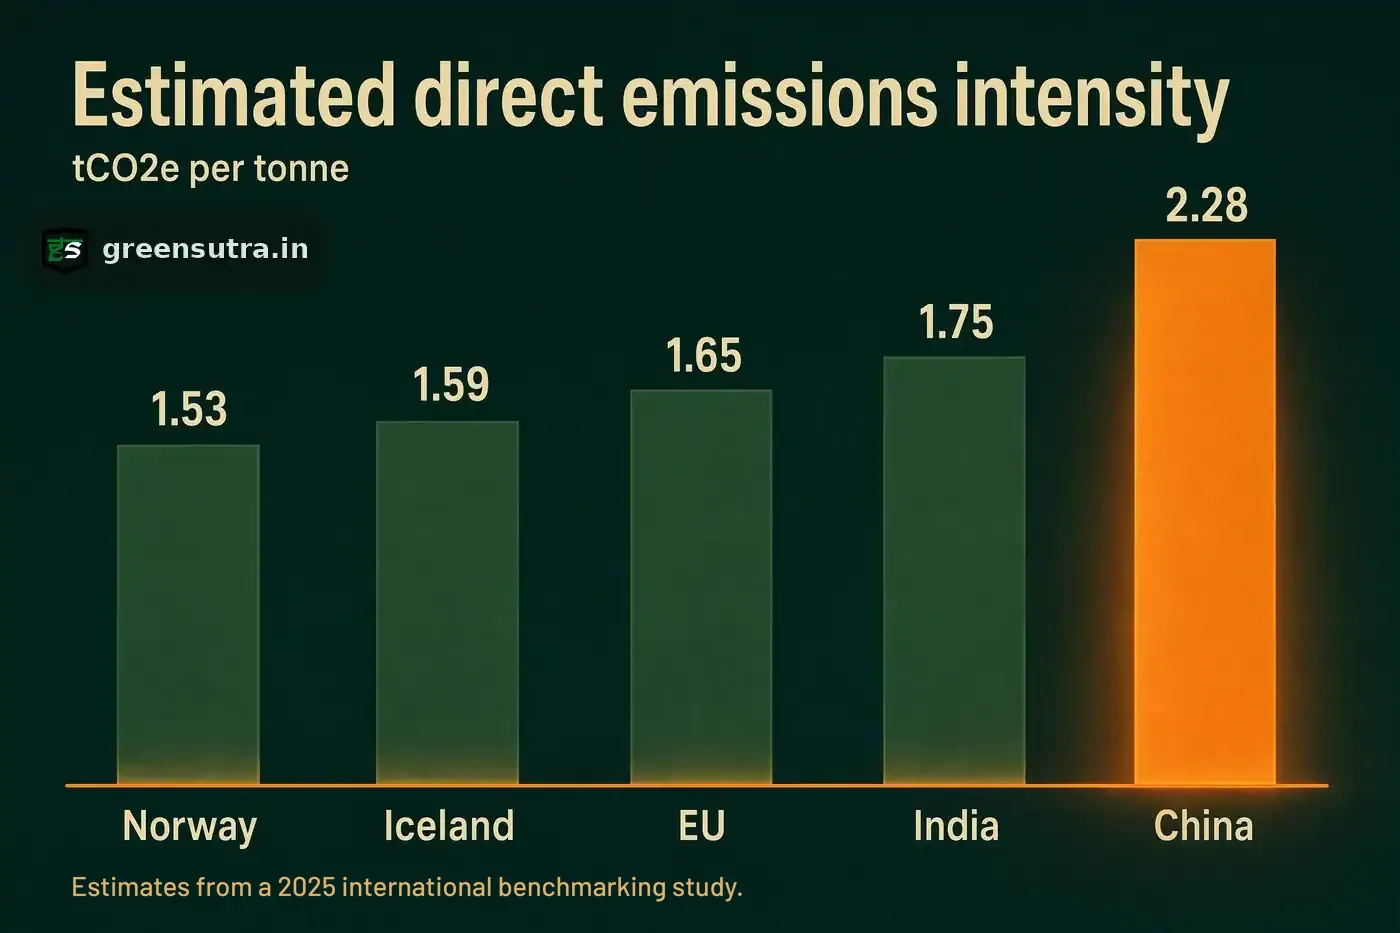
Chinese aluminium is the most exposed under CBAM for two reasons. China is the largest in-scope EU supplier at EUR 3.9 billion, 13.1 percent of 2024 imports, because top-five peers Norway, Iceland and Switzerland are Annex III exempt. China also shows the highest direct emissions intensity of the major routes, an estimated 2.28 tCO2e per tonne in a 2025 international benchmarking study.
Volume: the exemption map leaves China on top
China is the largest aluminium supplier actually inside CBAM’s scope. Eurostat data for 2024 puts EU aluminium imports (HS 76) at about EUR 29.5 billion, and three of the five biggest suppliers sit outside the mechanism entirely: Norway, Iceland and Switzerland appear in Annex III of Regulation (EU) 2023/956 because they participate in the EU ETS or a linked emissions trading system. Once those three drop out, the repricing lands first on China, then on Türkiye.
| Supplier | 2024 EU imports | Share | CBAM status |
|---|---|---|---|
| Norway | EUR 4.4bn | 15 percent | Exempt (Annex III) |
| China | EUR 3.9bn | 13.1 percent | In scope |
| Türkiye | EUR 2.8bn | 9.4 percent | In scope |
| Iceland | EUR 2.1bn | 7.3 percent | Exempt (Annex III) |
| Switzerland | EUR 1.7bn | 5.8 percent | Exempt (Annex III) |
The full ranking is broken down in the EU’s top aluminium suppliers under CBAM, and the exemption logic in why Norway and Iceland escape CBAM on aluminium.
Intensity: the highest direct emissions of the major routes
Chinese primary aluminium also runs the steepest per-tonne carbon of the major supply routes. Estimates from the same 2025 study put China at 2.28 tCO2e per tonne, against 1.60 to 1.65 for the Gulf producers, 1.65 for the EU and 1.75 for India. The exempt suppliers are also the cleanest, with Norway at an estimated 1.53 and Iceland at 1.59. One accounting nuance matters: aluminium is an Annex II good, so CBAM prices direct emissions only. The coal-heavy grid behind Chinese smelters adds nothing to the certificate obligation under the current scope. It is China’s direct smelting intensity, not its electricity mix, that is priced, and even on that direct-only basis Chinese metal sits well above every major competing route.
Implications for buyers and competing exporters
Buyers of Chinese metal shoulder the largest certificate exposure among the major origins. Certificates are due for the embedded emissions minus the free allocation adjustment, and the bill grows as that deduction shrinks. The CBAM factor is 97.5 percent in 2026, and from 2034 nothing is deducted for free allocation. In 2026, 2.5 percent of the benchmark is no longer deducted. That figure is not 2.5 percent of the embedded emissions.
- EU importers can model the position line by line in the CBAM cost calculator before renewing Chinese supply contracts, since volume and intensity land on the same invoice.
- Competing exporters in India and the Gulf hold a per-tonne advantage on paper; it becomes a declared advantage only when installation-level data replaces estimates and defaults and is verified by an accredited verifier.
- Preparing that data trail is consulting work: GreenSutra’s CBAM solutions service prepares importers and exporters for verification, which always sits with accredited verifiers.
Sources: Regulation (EU) 2023/956 · European Commission CBAM portal