

India leads EU iron and steel imports under CBAM at EUR 3.9 billion in 2024 (Eurostat), followed by South Korea at EUR 3.6 billion, China and Türkiye at EUR 3.5 billion each, and Vietnam at over EUR 2.2 billion, within a market of about EUR 39.5 billion plus EUR 33.6 billion of steel articles.
The 2024 market map
Eurostat data for reference year 2024 puts EU iron and steel imports at about EUR 39.5 billion, with a further EUR 33.6 billion of steel articles. Iron and steel is one of the six CBAM product groups, and the definitive regime has priced its embedded emissions since 1 January 2026.
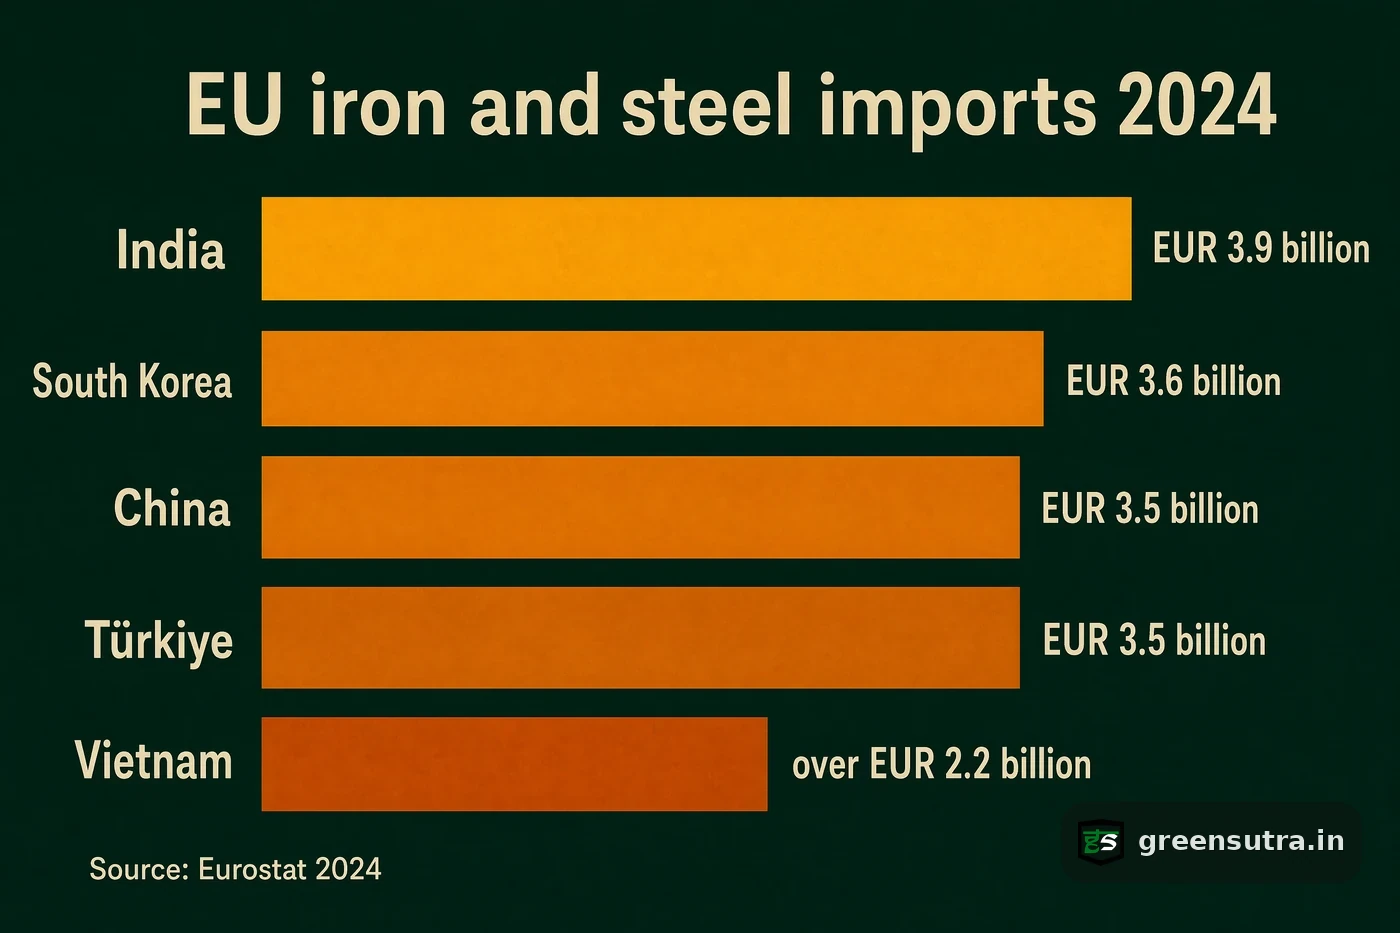
| Supplier | EU iron and steel imports 2024 | Note |
|---|---|---|
| India | EUR 3.9 billion | Largest single supplier (#1) |
| South Korea | EUR 3.6 billion | Second-largest supplier by 2024 import value |
| China | EUR 3.5 billion | Plus EUR 12.5 billion of steel articles |
| Türkiye | EUR 3.5 billion | EAF-heavy fleet, below-average emissions intensity |
| Vietnam | Over EUR 2.2 billion | Iron and steel is about 96 percent of its CBAM-covered EU exports |
Source: Eurostat, reference year 2024.
Why production route separates the leaders
Production route decides how much carbon each of these flows carries. The blast furnace to basic oxygen furnace (BF-BOF) route has the highest embedded emissions, gas-based DRI-EAF sits in between, and scrap-based EAF is the lowest. China supplies the EU from a BF-heavy fleet, the highest-emitting route. Türkiye runs an EAF-heavy fleet with below-average emissions intensity, so its defaults sit well under India’s, as the sibling answer on CBAM default values for Türkiye steel shows. Default values are specific to the country of origin under Implementing Regulation (EU) 2025/2621, so each supplier on this list carries its own set.
Concentration and pressure on the top suppliers
Exposure concentration matters as much as rank. Iron and steel accounts for about 90 percent of India’s CBAM-covered exports to the EU, about 96 percent for Vietnam and about 92 percent for Ukraine, so CBAM reprices almost the entire covered basket of these origins at once. GTRI reports that India’s iron and steel exports to the EU fell 35.1 percent to USD 3.05 billion in FY24-25, and estimates price-cut pressure of 15 to 22 percent on Indian suppliers. Three moves follow for any exporter on this list:
- Map each product against its country-of-origin defaults, starting from the sibling answer on CBAM default values for Indian steel exports.
- Model the certificate bill year by year in the CBAM cost calculator as the payable share climbs from 2.5 percent in 2026 to 100 percent in 2034.
- Prepare installation data with the CBAM solutions service, a consulting engagement running up to verification by an accredited verifier.
Sources: Regulation (EU) 2023/956 · Implementing Regulation (EU) 2025/2621 · European Commission CBAM