

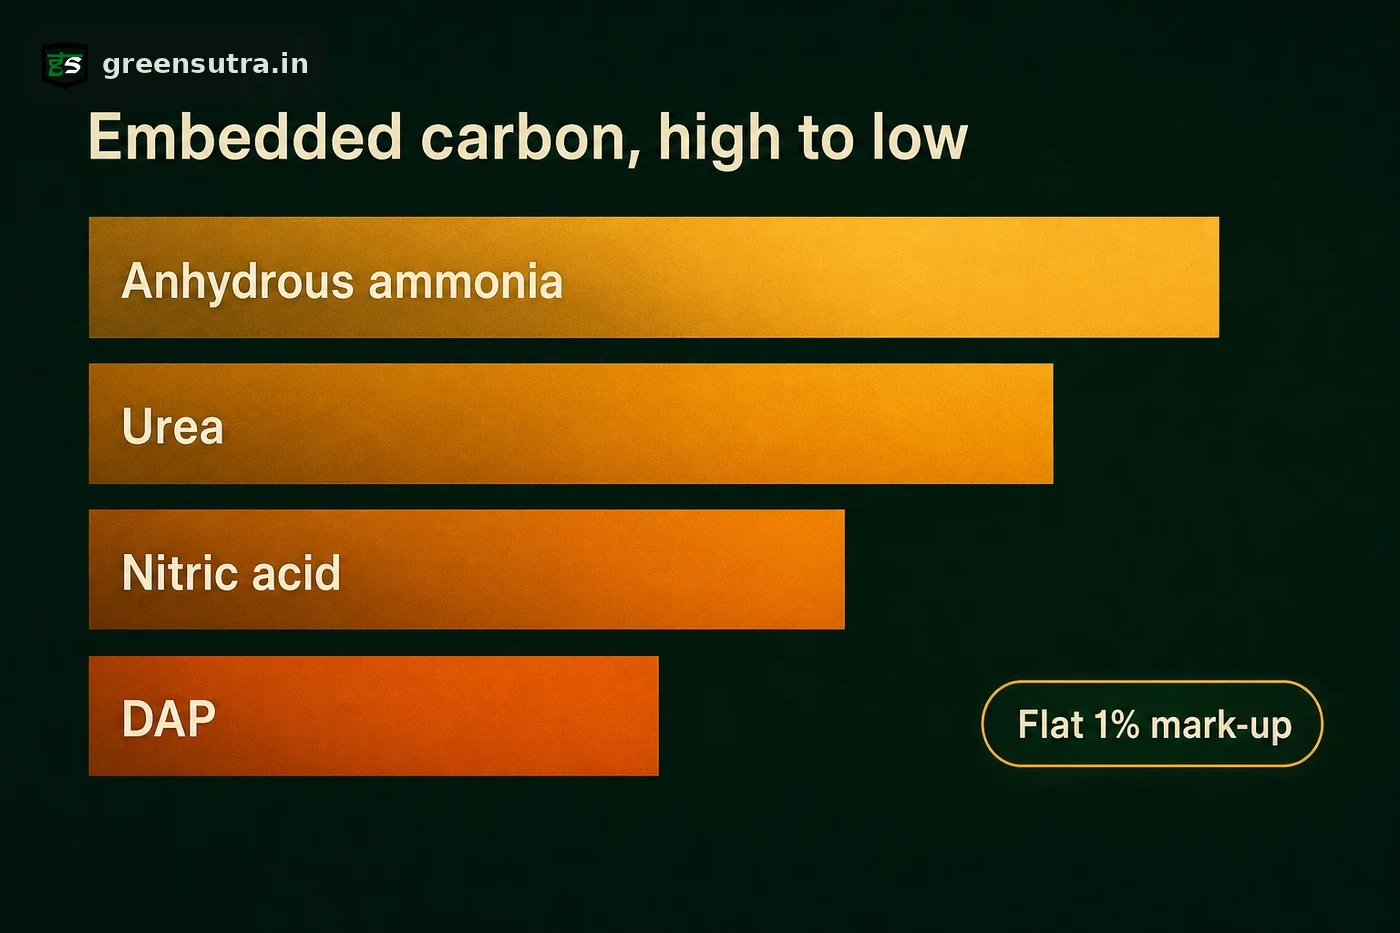
CBAM fertiliser default values are set per country of origin, each a base total of direct plus indirect emissions carrying a flat 1 percent mark-up held constant to 2028. Straight nitrogen products such as ammonia and urea carry the most embedded carbon on the India schedule, while phosphate blends sit lowest.
CBAM default values for fertilisers are set per country of origin, so no single figure applies everywhere. On the schedule published for India in Implementing Regulation (EU) 2025/2621, Annex I, straight nitrogen products carry the most embedded carbon and the phosphate blend the least. Every figure below is a base total combining direct and indirect emissions, because fertilisers, like cement, count grid electricity alongside process and fuel emissions.
India fertiliser default values (base tCO2e per tonne)
| Product | Representative CN | Base total |
|---|---|---|
| Anhydrous ammonia | CN 2814 10 00 | 3.28 |
| Urea | CN 3102 10 | 2.17 |
| Nitric acid | CN 2808 00 00 | 2.01 |
| Diammonium phosphate (DAP) | CN 3105 30 00 | 0.81 |
Natural gas is the feedstock and main emissions source for ammonia and urea, which is why those nitrogen lines head the table. These totals are the India figures only and do not carry across to other origins.
How the fertiliser mark-up differs
Fertilisers sit apart from the other CBAM groups on the mark-up applied above the base value.
- The rate is a flat 1 percent, identical across 2026, 2027 and 2028, rather than the 10, 20 and 30 percent ramp used for cement, steel, aluminium and hydrogen.
- The base already blends direct and indirect emissions, so an efficiency gain on either side lowers the declared figure.
- Verified installation data, confirmed by an accredited verifier, can declare below the default where a plant runs efficiently.
Consultants at GreenSutra note that the flat rate is often read as the escalating ramp, which overstates forecasts for the later import years.
Matching a product to its correct default line is one part of a fertiliser filing. CBAM compliance support covers declarant status, embedded-emissions calculation and certificate cost management. To turn a default into an estimated charge by product, volume and import year, the CBAM cost calculator applies the payable share and certificate price for each year.
Sources: Implementing Regulation (EU) 2025/2621 · Regulation (EU) 2023/956 · European Commission CBAM