


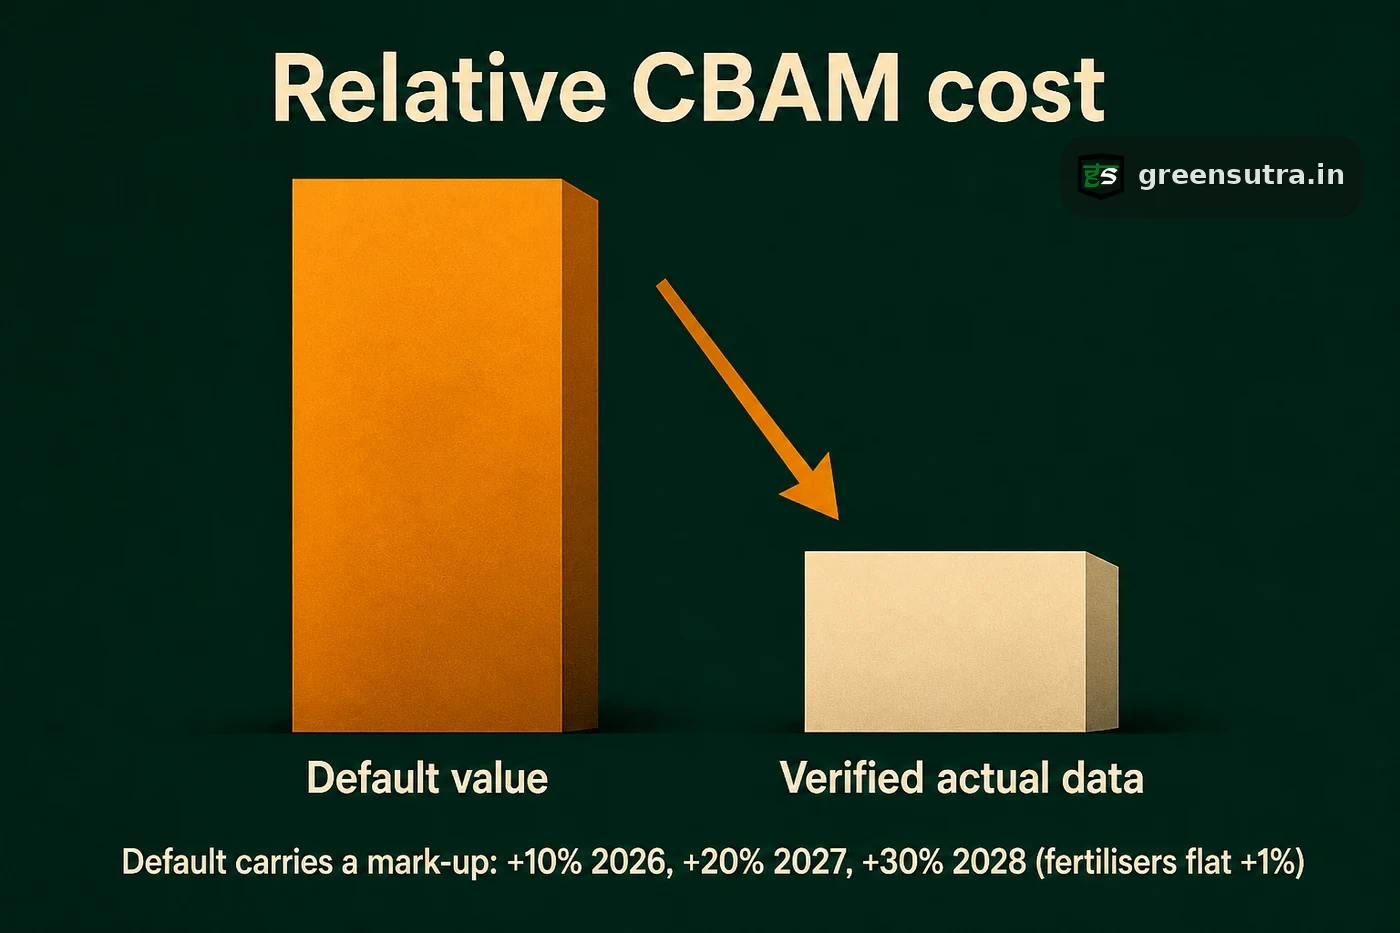
Verified actual installation data usually lowers an exporter’s CBAM cost, while default values raise it. Country-of-origin default values carry a mark-up, 10 to 30 percent for most sectors and a flat 1 percent for fertilisers, and deliberately overstate emissions. Verified plant data, once checked by an independent accredited verifier, typically prices real, lower emissions.
Default values versus verified actual data
Every CBAM declaration prices embedded emissions on one of two bases: the country-of-origin default value or verified actual installation data. Implementing Regulation (EU) 2025/2621, as corrected by Implementing Regulation (EU) 2026/1740 of 20 July 2026, sets the default values. Each carries a mark-up applied on top of the base figure.
| Basis | Emissions figure | Mark-up on the base | Typical effect on cost |
|---|---|---|---|
| Default value | Country-of-origin default from IR (EU) 2025/2621 | 10 percent in 2026, 20 percent in 2027, 30 percent from 2028 for cement, iron and steel, aluminium and hydrogen; a flat 1 percent for fertilisers | Overstates emissions, raises the payable cost |
| Verified actual data | Real emissions from the producing installation | None | Usually lower, lowers the payable cost |
Why verified data usually lowers the bill
The declarant surrenders certificates for the embedded emissions minus the free allocation adjustment, and minus any carbon price deduction, never below zero. The adjustment mirrors the free allocation EU producers of the same good still receive. On default values it is the good’s CBAM benchmark, times the CBAM factor for the year, times the cross-sectoral correction factor, times the mass imported. In 2026 the certificate price is the average EU ETS auction price for the quarter of import. The deduction shrinks each year. The CBAM factor is 97.5 percent in 2026, 95 percent in 2027, 90 percent in 2028 and 77.5 percent in 2029. It falls to 51.5 percent in 2030, 39 percent in 2031, 26.5 percent in 2032 and 14 percent in 2033. From 2034 nothing is deducted for free allocation. In 2026, 2.5 percent of the benchmark is no longer deducted. That figure is not 2.5 percent of the embedded emissions.
Example: one tonne of Indian hot-rolled flat steel (CN 7208) imported in the third quarter of 2026 on default values. The default value of 4.280 tonnes of CO2e, with the 10 percent mark-up, gives 4.708. The free allocation adjustment is 0.975 x 1.00 x 1.370, or 1.336. The declarant surrenders 4.708 minus 1.336, or 3.372 certificates, about EUR 278 at the third-quarter 2026 price of EUR 82.32. A default value is a deliberately conservative estimate, so a lower verified figure usually means fewer certificates. On actual data the free allocation adjustment is built from process benchmarks, so the saving is worked out case by case.
How the data is readied for verification
Article 7(2) of Regulation (EU) 2023/956 allows embedded emissions to be determined either from actual emissions or from default values. A complex good can combine actual emissions for the installation’s own processes with default values for one or more precursors, under Article 15 of Implementing Regulation (EU) 2025/2547. Actual data must be verified by a verifier accredited under the EU CBAM accreditation rules, Commission Delegated Regulation (EU) 2025/2551. That verification is always performed by an independent accredited third party, never by a consultant.
The CBAM cost calculator compares the default and verified paths for a specific product, volume and year; the CBAM guide sets out the reporting timeline; and a CBAM consulting service prepares installation data for verification by an accredited verifier.
Sources: Regulation (EU) 2023/956 · Implementing Regulation (EU) 2025/2621 · European Commission CBAM